Defining a random variable
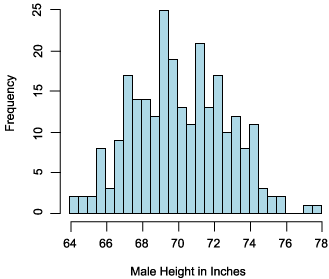
The frequency distribution of a random variable can be represented graphically with the y-axis displaying the frequency and the x-axis displaying the range of values the random variable can take on. The graph in Figure 1 depicts an actual frequency distribution for the random variable "Male Height in Inches":
Figure 1. Frequency distribution for a random variable

Intuitively speaking, a random variable is simply any variable whose value is determined in some way by chance. Because chance plays a role, each value that a random variable can take on will occur more or less frequently. A frequency histogram (such as in Figure 1) is a useful tool for understanding how frequently different values of a random variable occur.
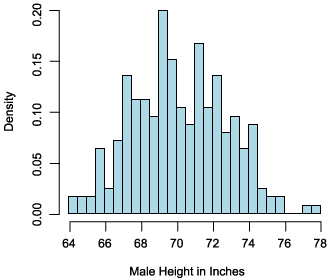
When developing a probability model for a random variable, it is often more useful to express the expected frequency of different outcomes in terms of probabilities that vary between 0 and 1 instead of using raw frequency counts. You can derive these y-axis probabilities by computing the number of observations that fall within a given interval and then dividing that number by the total number of observations. If you do this for each interval, you will get the probability distribution for your random variable (as shown in Figure 2).
Note that the male height probability distribution in Figure 2 is identical in shape to the frequency distribution. The only difference is that y-axis now measures probability density instead of frequencies.
Figure 2. Probability distribution for a random variable

Once you have clearly defined the random variable you are interested in, the next step is to measure the values your random variable generates. Ultimately you want to use this empirical information to construct the observed probability distribution for your random variable.
The graph of the observed probability distribution may immediately suggest a theoretical probability distribution (such as, a normal distribution). You can use a theoretical distribution, in lieu of the observed probability distribution, to derive inferences about the probability of observing various types of outcomes of concern.
In other words, after you clearly define your random variable (for instance, customer orders per week), then gather measurements of it (through experiments, questionnaires, sales logs, access logs, data mining), you can proceed to the model-fitting stage to:
- Plot your observed probability distribution
- Find a theoretical probability distribution to use in place of the observed probability distribution
View Apply probability models to Web data using PHP Discussion
Page: 1 2 3 4 5 6 7 8 9 10 11 Next Page: Model fitting